Debugging Overview
Real-time visibility into your RAG pipeline with the Debug Panel TUI.
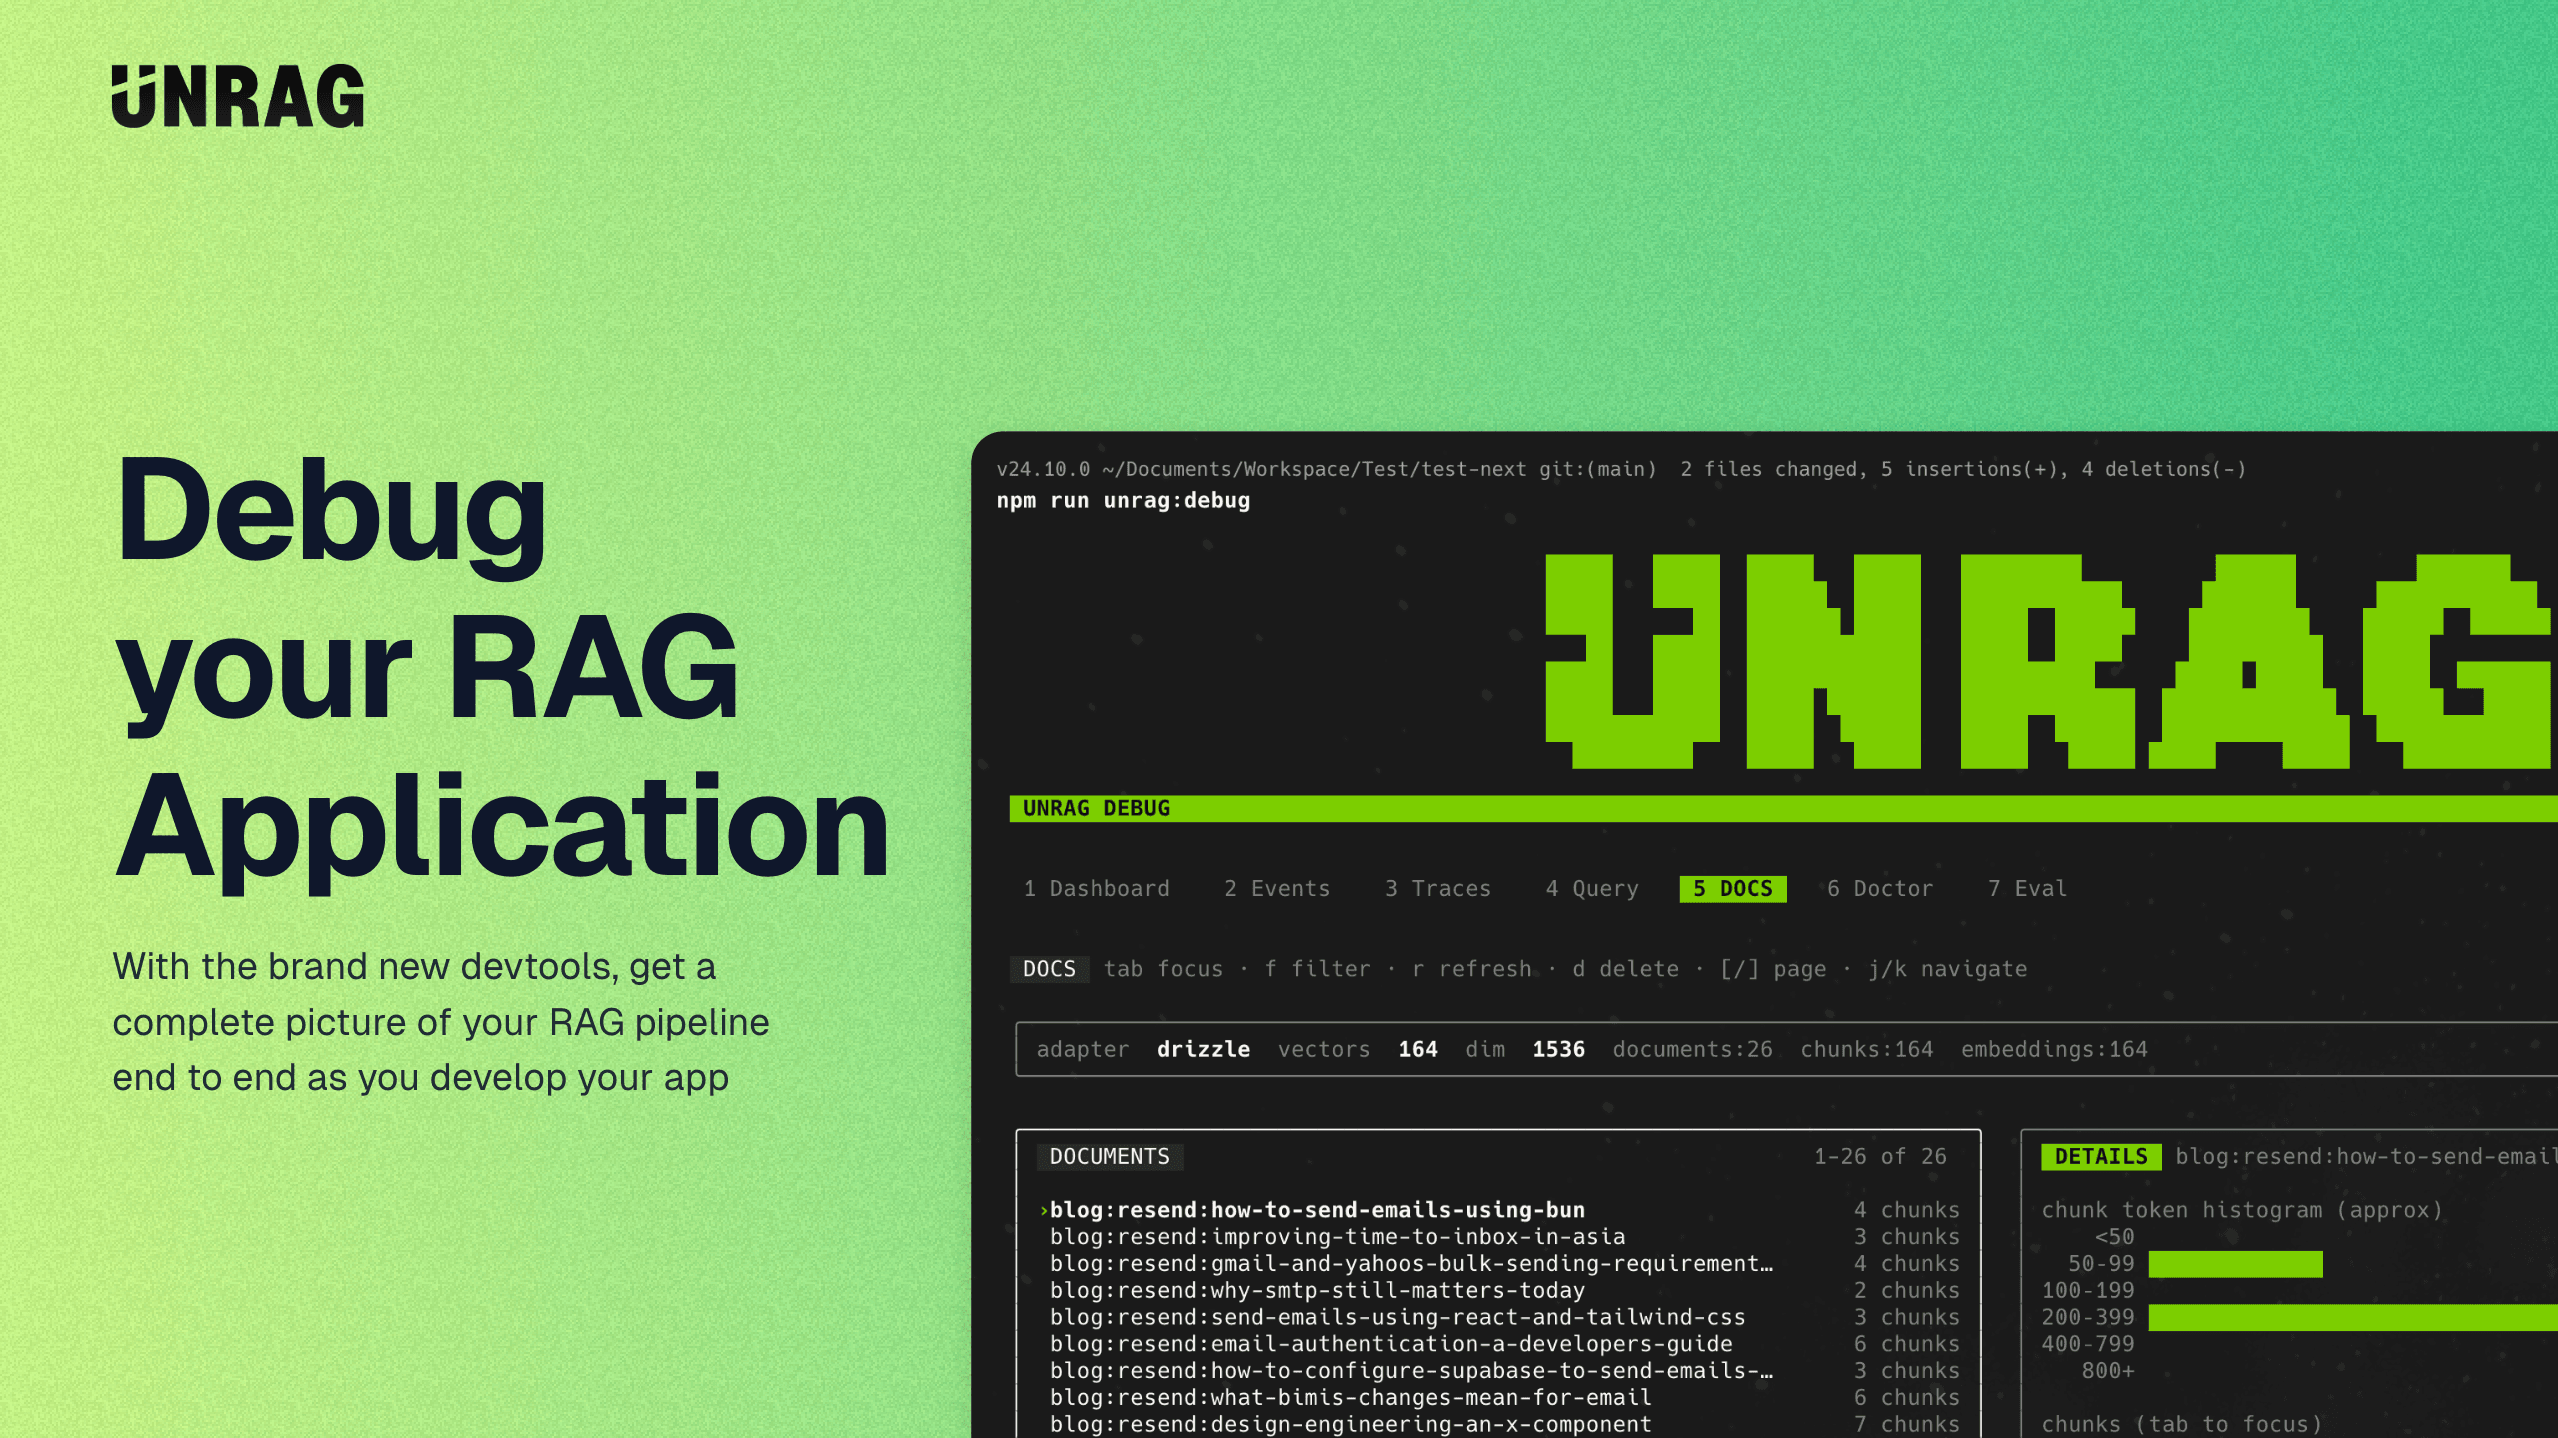
When something goes wrong with retrieval—a query returns irrelevant results, ingestion takes longer than expected, or chunks appear malformed—the typical debugging process involves adding console logs, re-running operations, and piecing together what happened from scattered output. The Debug Panel takes a different approach.
The debug battery adds a WebSocket-based debugging server to your application that streams events as they happen. Every ingest operation, every retrieval, every rerank call emits structured events that you can observe in real time. On the other end, the unrag debug CLI command opens a terminal interface that connects to your running app and gives you a live view of what's happening inside.
This architecture means you don't need to modify your code to debug—just set an environment variable, run your app, and connect the TUI. The debug server runs alongside your application, watching operations without interfering with them.
The two-part system
The Debug Panel has two components that work together:
The debug server runs inside your application process. When UNRAG_DEBUG=true is set, Unrag automatically starts a WebSocket server (default port 3847) that broadcasts debug events and accepts interactive commands. Your application code doesn't change—the server hooks into the engine's event emitter and streams everything to connected clients.
The debug TUI is a terminal interface you launch separately with bunx unrag debug. It connects to the WebSocket server, subscribes to events, and renders an interactive dashboard. From the TUI you can watch operations in real time, run queries against your vector store, inspect documents, and diagnose configuration issues.
This separation is intentional. The debug server adds minimal overhead to your application (just event broadcasting over WebSocket), while all the rendering and interaction logic lives in the CLI. You can have multiple TUI instances connected simultaneously, which is useful when collaborating or comparing behavior across terminal sessions.
What you can do
The TUI provides eight tabs, each serving a different debugging need:
| Tab | Purpose |
|---|---|
| Dashboard | Live operation counts, latency metrics, and recent events at a glance |
| Events | Full event stream with filtering by operation type |
| Traces | Grouped views of complete operations for timing analysis |
| Query | Run queries interactively and inspect results |
| Docs | Browse stored documents, view chunks, delete problematic content |
| Ingest | Ingest test documents without writing code |
| Doctor | Configuration diagnostics and health checks |
| Eval | Run evaluation datasets and view quality metrics |
Each panel is documented in detail in the Panels section.
When to use the Debug Panel
The Debug Panel is most valuable during development and troubleshooting. Use it when:
- You're building a new ingestion pipeline and want to see how content gets chunked
- A query returns unexpected results and you need to understand the retrieval scores
- You're tuning chunk sizes or overlap and want to see the effect on document structure
- Ingestion is slower than expected and you need to identify the bottleneck
- You're setting up a new environment and want to verify everything is configured correctly
In production, you typically wouldn't leave UNRAG_DEBUG=true enabled—the event streaming adds a small amount of overhead and the WebSocket port shouldn't be exposed publicly. The debug battery is primarily a development and staging tool.
What's next
Getting Started
Install the debug battery and connect to your first session
Understanding Events
Learn what each event type reveals about your pipeline
Best Practices
Effective workflows for common debugging scenarios
Dashboard Panel
Start exploring the TUI with the Dashboard overview
RAG Handbook: Observability
Comprehensive guide to instrumenting and debugging production RAG pipelines