Observability and debugging
Instrument retrieval and generation so regressions and incidents are diagnosable, not mysterious.
When your RAG system returns a wrong answer in production, you need to understand why. Was the right document not retrieved? Was it retrieved but ranked too low? Was the context correct but the generation went astray? Without observability, you're left guessing. With good instrumentation, you can trace exactly what happened and fix it.
RAG observability is harder than traditional application observability because the pipeline has multiple stages, each with its own failure modes. A request touches embedding, retrieval, reranking, context assembly, and generation—any of which might be the culprit. Your instrumentation needs to capture enough at each stage to reconstruct what happened without capturing so much that you drown in data or create privacy risks.
The diagnostic trace
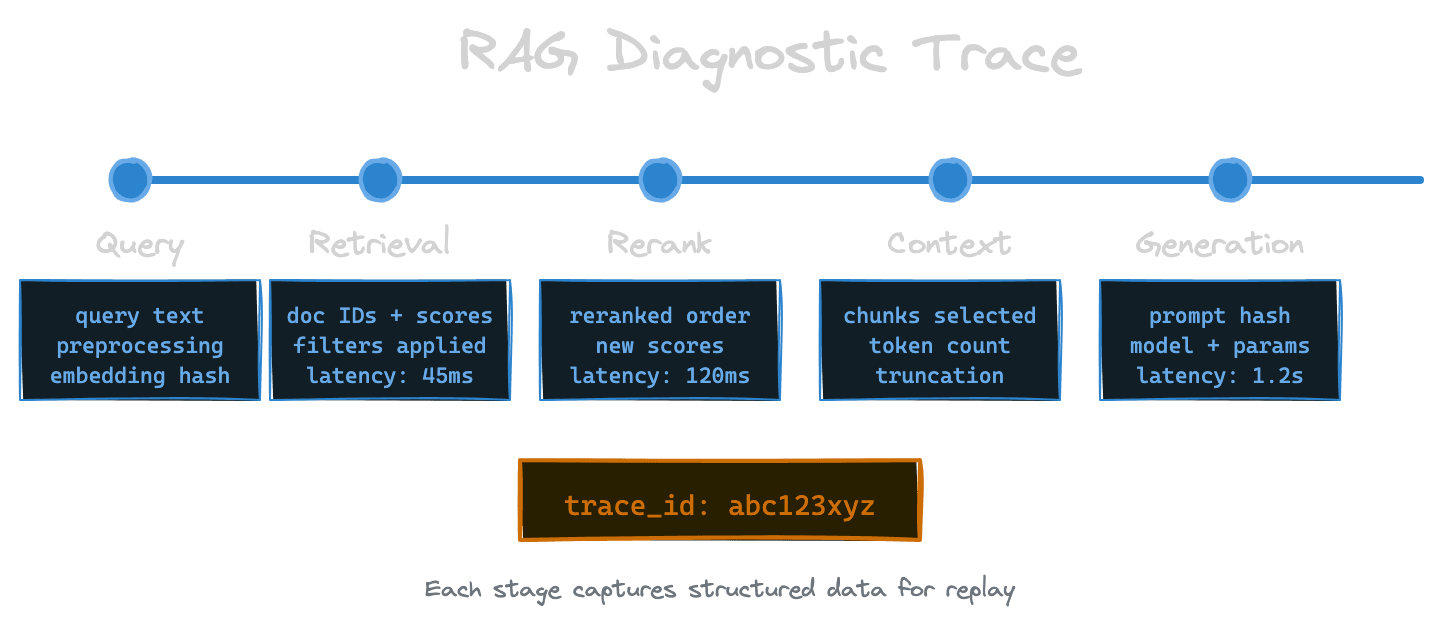
The fundamental unit of RAG observability is the trace: a complete record of how a single query flowed through the pipeline. A useful trace captures the query text, the embedding (or at least a hash of it for correlation), the raw retrieval results with scores, the reranked results if applicable, the assembled context, the generation prompt, and the generated response.
Think of the trace as a replay log. Given a trace, you should be able to understand every decision the system made. If retrieval returned the wrong documents, the trace shows what was returned and why it ranked higher than the correct document. If reranking shuffled the order poorly, you can see the before and after. If generation hallucinated despite good context, you can see exactly what context was provided.
Traces should be structured data, not just log lines. You want to query them: show me all traces where the top-3 retrieval results had similarity below 0.7, or where generation took more than 2 seconds, or where a specific document ID was retrieved. This requires a schema that's consistent across requests.
With Unrag: The debug battery provides real-time observability with a terminal UI that shows traces, timing breakdowns, and chunk details for each ingest and retrieve operation.
What to capture at each stage
At the query stage, capture the raw user query, any preprocessing applied (lowercasing, expansion, rewriting), and the query embedding or a stable identifier for it. If you're doing multi-query retrieval, capture all generated sub-queries.
At the retrieval stage, capture the index queried, the filter conditions applied, the number of candidates requested, the results returned with their IDs, similarity scores, and key metadata. You don't need to capture full document text here—IDs and scores are usually enough for diagnostics, and you can retrieve the text when needed.
At the reranking stage, capture the input set (which candidates went in), the output set (how they were reordered), and the reranker scores. Seeing the delta between retrieval ranking and reranker ranking is diagnostic gold—large swings indicate the reranker is doing significant work.
At the context assembly stage, capture which chunks were selected for inclusion, how they were truncated, and the total token count. If you're doing context compression, capture both the input and output.
At the generation stage, capture the full prompt (or a redacted version if it contains sensitive data), the model used, the generation parameters, and the response. Capture latency for this stage separately since it's often the largest contributor.
Latency breakdowns
Beyond capturing what happened, capture how long each stage took. Aggregate latency hides problems. If your end-to-end p95 is 3 seconds, you need to know whether that's 2 seconds in retrieval, 0.5 seconds in reranking, and 0.5 seconds in generation—or 0.3 seconds in retrieval and 2.7 seconds in generation.
Instrument each stage with timing. Many systems already provide this—your vector database gives query timing, your LLM provider gives generation timing—but you need to collect and correlate these metrics. Build dashboards that show latency distribution by stage. When latency spikes, you'll immediately know which stage is responsible.
Watch for the difference between p50 and p99 latency. A stage might have fast median latency but terrible tail latency, indicating occasional slow operations (cold cache hits, network hiccups, rate limit retries). P99 matters for user experience because 1% of users see that latency, and those users might be vocal.
Safe logging and redaction
Production queries contain user data. Production documents might contain sensitive information. Your traces and logs need to handle this responsibly.
Decide upfront what can be logged in full, what should be redacted, and what should never be logged. Query text often needs redaction or hashing in privacy-sensitive contexts. Document content probably shouldn't be logged in full—IDs and titles are usually sufficient for debugging.
Build redaction into your logging pipeline, not as an afterthought. Log a hash of the query for correlation without logging the query itself. Log document IDs but fetch content on-demand when investigating. If you must log content, ensure logs are access-controlled and have retention policies.
Consider separate log levels or streams: a low-volume detailed trace for sampled requests that's retained briefly for debugging, and a high-volume metrics stream that captures aggregates without sensitive details.
Debug payloads for reproduction
When something goes wrong, you want to reproduce it. Build the ability to export a "debug payload" from a trace: a self-contained record that lets you replay the query against your current system and compare results.
A good debug payload includes the original query, the embedding (so you can reproduce retrieval exactly), the relevant filter conditions, and the expected behavior. With this, you can run the query in a test environment, compare against the original trace, and see what changed.
This is invaluable for regression testing. When users report a query that used to work and now doesn't, you can compare the traces to see exactly where behavior diverged. When you're testing a model or config change, you can replay saved payloads and verify the change improves (or at least doesn't hurt) known cases.
Alerting and anomaly detection
Observability isn't just for post-hoc debugging; it should drive proactive alerting.
Alert on latency degradation—both absolute thresholds (p99 > 5 seconds) and relative changes (p50 increased 50% from yesterday). Alert on error rates in any stage. Alert on retrieval returning unusually low similarity scores, which might indicate embedding model problems or corpus issues.
More sophisticated systems can alert on semantic anomalies: a sudden increase in queries that retrieve nothing relevant, a spike in refusal rates from generation, or a drop in citation accuracy if you're measuring it. These require baseline establishment but catch problems that simpler alerts miss.
Connecting traces to user feedback
Traces become most valuable when you can connect them to outcomes. When a user reports a bad answer, you need to find the corresponding trace. When users give thumbs-down feedback, you should capture or correlate to the trace for that request.
Design your system so feedback can be associated with traces. This might mean returning a trace ID in your API response that the frontend can send back with feedback. It might mean logging a correlation ID that appears in both the trace store and the feedback store.
The payoff is a dataset of traces labeled with user satisfaction. This lets you analyze what distinguishes good responses from bad ones. Maybe bad responses correlate with low retrieval scores. Maybe they correlate with a specific document set. Without this connection, you're improving blind.
Next
With observability in place, the next chapter covers latency budgets—how to design fast-path and deep-path retrieval flows that respect performance targets without sacrificing correctness.