Debugging with eval slices
Slice by tenant, doc type, query type, and risk class to find what's actually broken.
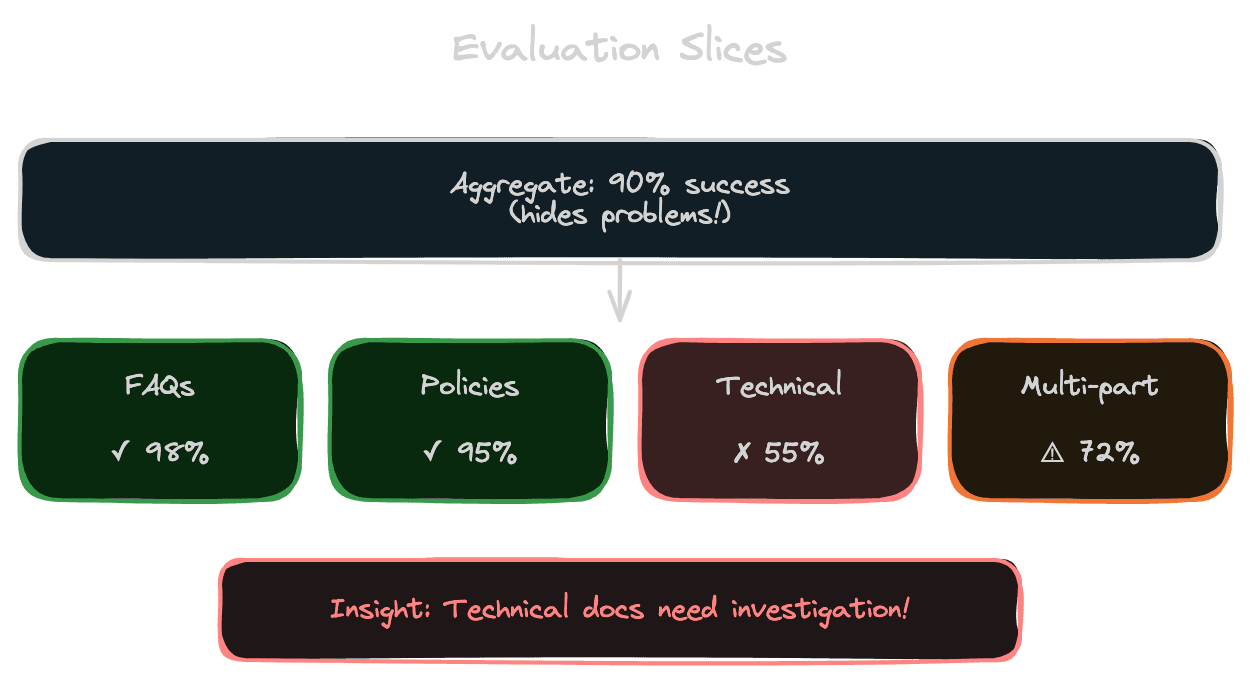
Aggregate metrics hide important details. A 90% success rate across all queries might mask a 99% rate on easy queries and a 50% rate on hard queries. To debug quality problems, you need to slice your evaluation data—break it into meaningful subsets and measure each slice separately. Slices reveal where your system is strong, where it's weak, and where to focus improvement efforts.
Why slicing matters
When overall metrics drop, you need to know what changed. Was it a specific query type? A particular content area? A tenant with unusual data? Without slices, you're searching blindly.
When overall metrics look fine but users complain, slices can reveal hidden problems. Users from one team might be having a terrible experience while users from another team are fine. The aggregate hides the problem.
When comparing two systems, slices show nuance. The new system might be better overall but worse on a critical slice. That's important to know before shipping.
Designing useful slices
Good slices isolate factors that might affect quality.
Query type slices separate questions by structure: factual questions, how-to questions, comparison questions, multi-part questions. Different query types have different difficulty profiles.
Content type slices separate by source: FAQs, technical documentation, policies, user-generated content. Quality might vary significantly by content type, especially if content quality varies.
Document age slices check whether recency affects quality. Recent documents might have different characteristics than old ones.
Query length slices separate short queries (often ambiguous) from long queries (often specific). Short queries are typically harder.
Tenant or user slices for multi-tenant systems. Quality might vary by tenant based on their content volume, content quality, or query patterns.
Risk class slices separate high-stakes queries (medical, legal, financial) from low-stakes ones. You may need different quality bars for different risk levels.
Success/failure slices group by whether the query succeeded or failed. Analyzing failures as a group can reveal patterns.
Isolating one factor at a time
When diagnosing a problem, control for confounding factors.
If queries about "Product X" are failing, is it because Product X documentation is bad, because Product X queries are complex, or because Product X uses unusual terminology? To isolate, compare Product X documentation queries to similar-complexity queries about other products. Compare Product X queries to different-complexity queries about Product X.
If a tenant is having problems, is it tenant-specific or just that they use the system differently? Compare that tenant's query types to other tenants' queries of the same type.
Controlled comparisons reveal root causes. Uncontrolled comparisons conflate multiple factors.
Interpreting slice results
When you find a slice with poor quality, investigate why.
Data issues: Is the content in this slice lower quality? Are there indexing problems? Is the ground truth wrong for this slice?
Query-content mismatch: Do users in this slice phrase things differently than the content? Is there a vocabulary gap?
Retrieval issues: Check retrieval metrics for the slice specifically. Is the problem finding the right content?
Generation issues: If retrieval is fine but answers are bad, the problem is in generation. Check faithfulness and format on this slice.
Edge case accumulation: Some slices might represent edge cases that any system would struggle with. It's okay to accept lower quality on edge cases as long as you're aware.
Distinguishing quality drops from distribution shift
When slice metrics change, it could mean quality changed or the query distribution changed.
If recall on "Product X queries" dropped, but you're now getting more complex Product X queries, quality might be stable—you're just seeing harder queries. The distribution within the slice shifted.
Compare like to like. If you have query difficulty estimates, compare same-difficulty queries over time. If you have labeled subsets, track those specifically.
Maintain a fixed "golden set" of queries that don't change. This set provides a stable benchmark immune to distribution shift. If the golden set metrics drop, quality truly regressed.
Building an always-on dashboard
Turn slice analysis into continuous monitoring.
Create a dashboard that shows key metrics broken down by slices. Update it as you run evals. Make it visible to the team.
Set up alerts on slice-level metrics, not just aggregates. An alert on overall recall might miss a 30% drop in one slice; an alert on that slice catches it.
Track slices over time to see trends. Gradual degradation in a slice might indicate creeping problems with that content area or query type.
From slices to action
Slice analysis should lead to action.
If a content type slice is failing, investigate and improve that content: better chunking, more coverage, content cleanup.
If a query type slice is failing, improve handling of those queries: better query rewriting, specialized prompts, targeted examples.
If a tenant slice is failing, work with that tenant: understand their needs, improve their content, adjust their configuration.
If a risk class slice is failing, prioritize—high-risk failures need immediate attention.
Track the impact of interventions. After fixing something, measure whether the targeted slice improved. Confirm your fix worked before moving on.
Next module
With evaluation covered, Module 8 addresses production operations—taking your RAG system from development to reliable production deployment.