Caching and performance
Make retrieval fast - cache embeddings, index intelligently, and observe your p95s.
Retrieval latency directly affects user experience. Users waiting for a response notice every extra hundred milliseconds. For conversational interfaces, responsiveness matters as much as accuracy. This chapter covers techniques for making retrieval fast enough for interactive applications while maintaining quality.
Where latency hides
Retrieval latency comes from several sources, and you need to understand where your time goes before optimizing.
Query embedding converts the user's text to a vector. This requires an API call (for cloud embedding services) or local inference (for self-hosted models). Cloud APIs typically take 50-200ms; local inference depends on your hardware and model size.
Vector search finds similar chunks in your index. With a well-tuned ANN index, this is often the fastest step—10-50ms for indexes with millions of vectors. With exact search or poorly tuned indexes, it can be much slower.
Filtering applies metadata constraints. Simple filters on indexed fields are fast; complex filters or post-retrieval filtering adds time.
Reranking (if used) re-scores candidates with a more sophisticated model. This is typically 100-300ms for a cross-encoder on 20-50 candidates.
Database round-trips for fetching full chunk content after getting IDs from the index. If your index stores only vectors and IDs, you need additional queries to fetch the text.
Profile your retrieval pipeline to understand the breakdown. The slowest step is where optimization effort will pay off.
Caching query embeddings
If users ask similar questions, you're computing the same embeddings repeatedly. Caching embeddings for common queries eliminates redundant work.
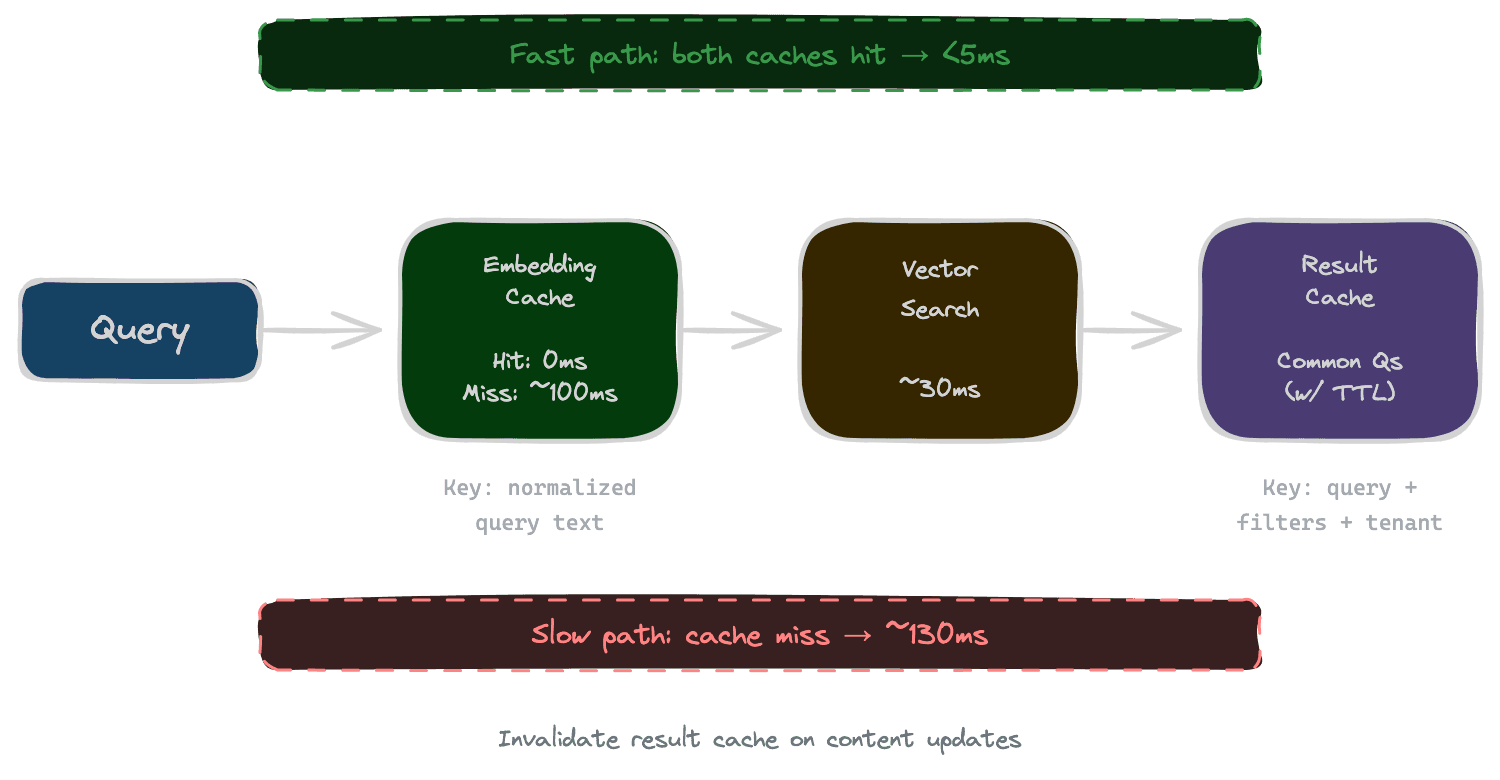
The cache key is typically a normalized version of the query text (lowercased, whitespace-normalized). The cached value is the embedding vector. When a query arrives, check the cache first; only call the embedding API on a miss.
Cache size and eviction policy matter. An LRU cache of the most recent N thousand queries works for many applications. Monitor hit rate—if it's low, the cache isn't helping much; if it's high, you're saving significant compute.
Caution: if you change embedding models, you must invalidate the cache. Cached embeddings from the old model are useless with the new model and will produce wrong results.
Caching retrieval results
For truly common queries, you can cache the full retrieval result—not just the embedding, but the retrieved chunks themselves.
This works when queries repeat frequently and content doesn't change often. A documentation search where users ask the same common questions benefits from result caching. A support system where every question is unique does not.
Cache invalidation is critical. When content updates, cached results might return stale or missing information. Options include time-based expiration (results cached for 10 minutes), event-based invalidation (clear cache when content updates), and version-keyed caching (include content version in cache key).
Result caching is more complex than embedding caching but has larger payoffs when hit rates are high.
Index tuning for latency
Your vector index configuration affects search latency. ANN indexes trade recall for speed; the parameters control this tradeoff.
For HNSW indexes, the ef_search parameter controls how many candidates are considered during search. Higher values give better recall but take longer. For latency-sensitive applications, tune ef_search to meet your latency budget while maintaining acceptable recall.
For IVF indexes, nprobe (number of clusters to search) has a similar effect. More probes means higher recall but slower search.
The right settings depend on your index size, latency requirements, and recall targets. Measure recall and latency across a range of parameter values, then choose the combination that meets your requirements.
Rebuilding indexes with different parameters (like HNSW's m and ef_construction) can also improve performance, though this requires reindexing all content.
Tiered retrieval
Not all queries need the same retrieval depth. A simple factual question might be answered by a quick, shallow retrieval; a complex research question might justify slower, more thorough search.
Tiered retrieval uses a fast path for simple queries and a deep path for complex ones. The fast path might use a smaller index, fewer candidates, skip reranking, and have aggressive timeouts. The deep path might search more comprehensively, use reranking, and tolerate higher latency.
Query classification determines which path to use. Simple heuristics (query length, question type) or a lightweight classifier can route queries appropriately.
The benefit is maintaining responsiveness for common simple queries while still supporting complex queries that need more processing.
Parallel versus sequential operations
Retrieval often involves multiple operations that can run in parallel: embedding the query while fetching user permissions, searching multiple indexes simultaneously, or running vector search and keyword search in parallel.
Parallel execution means total latency is the maximum of the parallel operations, not their sum. If query embedding takes 100ms and vector search takes 50ms, running them in sequence takes 150ms; running them in parallel takes 100ms.
Audit your pipeline for sequential operations that could be parallel. Common opportunities include query embedding concurrent with permission lookups, multi-index searches concurrent with each other, and vector search concurrent with BM25 for hybrid retrieval.
Be mindful of resource limits. Parallelism uses more concurrent connections and compute. Don't parallelize to the point of exhausting connection pools or overwhelming downstream services.
Monitoring and alerting
You can't maintain performance without observing it. Monitor latency at each pipeline stage, not just end-to-end.
Track percentiles, not just averages. If your average latency is 100ms but p95 is 800ms, 5% of users are having a bad experience that the average hides.
Set alerts for latency degradation. If p95 increases by 50% compared to last week, something has changed. Catch it before users notice.
Log slow queries for investigation. When latency exceeds a threshold, record the query, timing breakdown, and relevant context. This data helps diagnose performance issues.
Next
With retrieval fast and efficient, the final chapter provides a systematic playbook for debugging retrieval failures when they occur.